When debugging Silverlight applications, I am sure some of you have already faced this situation. You have put several breakpoints in your Silverlight project, but when you are debugging through the browser, breakpoints doesn’t get hit. When you hover on the breakpoint, you can see the message “The breakpoint will not currently be hit. No symbols have been loaded for this document.”.
I have faced this situation many times in the past years and somehow managed to fix it. Today after long time did some Silverlight programming and I happened to face this scenario which was a real pain. Unfortunately I can’t seem to remember what I have done past to resolve the issue. I am putting a post here mentioning some resolutions, so in future it might help someone.
- First of all make sure you are running the application using Internet Explorer. If you are using any other browser other than Internet Explorer, you will have to use Visual Studio's Attach to Process for debugging.
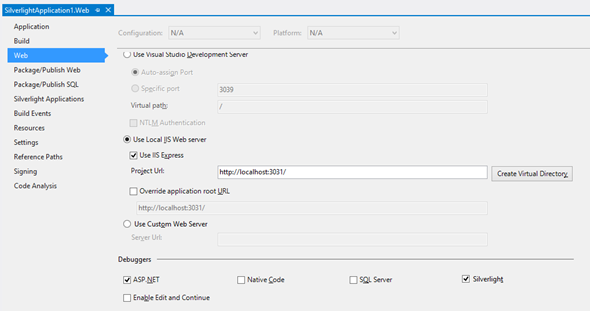
- In your web application which hosts the Silverlight application, make sure Silverlight debugger is enabled. (Right click on the web application->Properties. In Web tab, under Debuggers section make sure Silverlight is enabled.)
Hope this helps.
Happy Coding.
Regards,
Jaliya

No comments:
Post a Comment